What is USDT Dominance (USDT.D)? What does it measure and why is it significant for crypto?
Understanding USDT.D: Key Insights into Tether Dominance and Crypto Market Trends
MARKET INSIGHTS
8/25/20242 min read


Disclaimer: This analysis is for informational purposes only and should not be considered financial advice. Cryptocurrency markets are highly volatile, and investments carry risk. Always do your own research or consult with a financial advisor before making investment decisions.
Image via Grok
What is USDT Dominance or USDT.D?
USDT Dominance or USDT.D serves as a valuable sentiment indicator within the cryptocurrency market.
An increase in USDT.D indicates that a larger portion of market participants is moving their assets into USDT. This behavior often reflects a shift towards caution, as traders may seek to protect their capital from market volatility by holding a stable asset. Conversely, a decrease in USDT.D suggests that investors are reallocating their funds from USDT into other cryptocurrencies, which may indicate growing confidence and risk appetite in the market.
Dominance signifies the proportion of the total market capitalization that a particular asset, such as USDT, represents. USDT.D, therefore, measures the share of the total cryptocurrency market value that is allocated to USDT. USDT is a type of cryptocurrency known as a stablecoin, which is pegged to the US dollar. This peg ensures that USDT maintains a value close to $1, offering stability in contrast to the inherent volatility of other cryptocurrencies like Bitcoin or Ethereum.
So how has dominance performed?
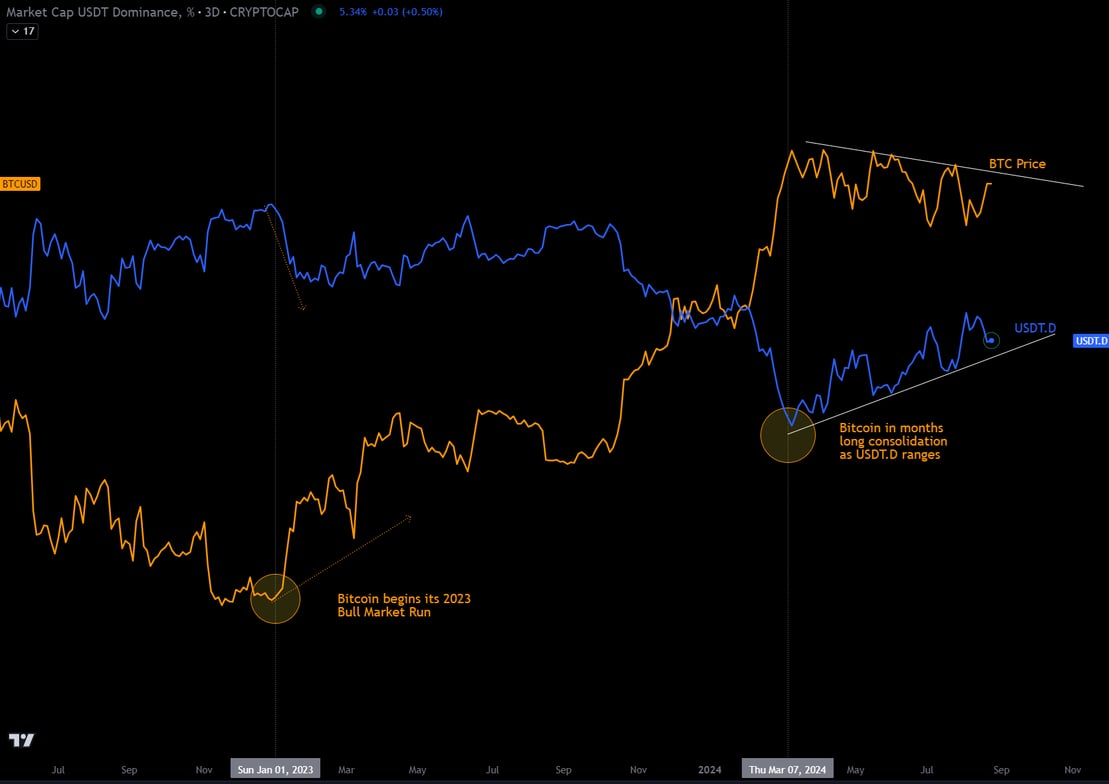
Plotting USDT.D against the price of Bitcoin reveals a clear inverse correlation between the two. As USDT.D began to decline shortly after the FTX fallout, Bitcoin's price started to surge, marking the beginning of a bull run. Throughout most of 2023, USDT.D fluctuated between 6.5% and 8%. Entering 2024, USDT.D plunged further, and Bitcoin experienced a strong impulse wave, briefly surpassing its previous all-time high (ATH) from 2021. Since the start of the year, USDT.D, Bitcoin, and the total cryptocurrency market capitalization have exhibited ranging behavior.
The chart underscores that the magnitude of change is not linear. Analysts might find it unproductive to attempt to quantify Bitcoin's price movement based on a 1 basis point change in USDT.D. Additionally, it is important to recognize that correlation does not imply causation. The chart primarily reflects investor psychology—periods when investors seek safety versus times when they return to riskier assets—during downturns, ranging periods, and strong impulsive cycles within a broader bull market.
At knowledge tree capital, we view USDT.D as just one component of a broader analytical framework. We believe that instead of relying on assets or indicators with loose correlations, it is more effective to analyze the price structure of the specific asset in question when forecasting price movements. However, such indicators can be useful when the primary analysis does not provide a clear picture. In these cases, assets with correlations can serve as additional data points to find confluence or shape a more comprehensive viewpoint.